You Are What You Breathe? Measuring Air Quality in Berlin
23.12.2014

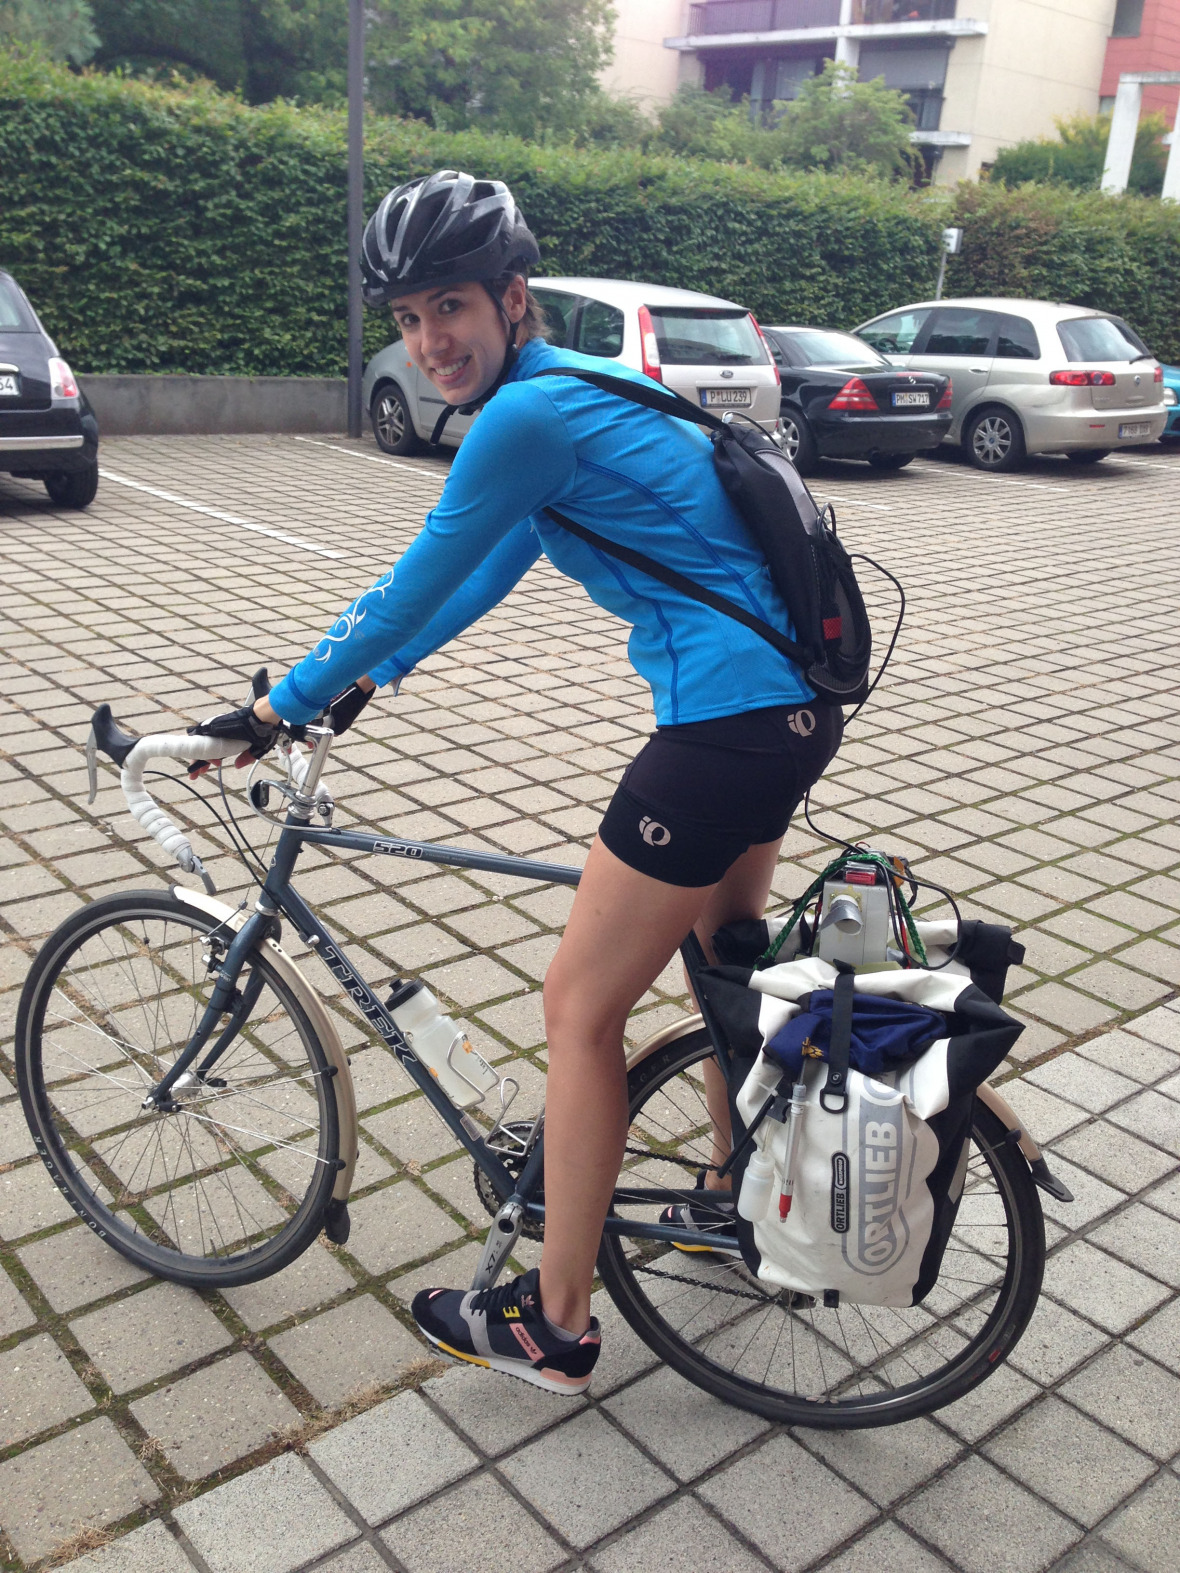
Berlin may not be the Netherlands, but there is definitely a fair amount of bicycling infrastructure throughout the city. And if you’re biking in Berlin you’re not alone on the road with only cars for company either. The debate about which cities are the best for biking aside, I enjoy biking, and this summer I biked home from work at least once a week. For me, this meant a journey of roughly 30 km and just under two hours depending on traffic, traffic lights, and how much energy I had at the end of the work day. I started the rides in Potsdam at the Institute for Advanced Sustainability Studies and ended on the opposite side of Berlin in Friedrichshain. The route I biked took me on wide, car-traffic-free paths through the forested Grunewald, congested city roads through Charlottenburg, and somewhat more bike-friendly city roads in Mitte and Friedrichshain. This isn’t to say that there aren’t bike-friendly non-congested roads in Charlottenburg, but that’s just not where my relatively direct route home snaked through Berlin. And actually, these characteristically different surroundings might make the science of it more interesting in the end. Because although I like biking, on these rides I wasn’t just biking for the fun of it, I was also collecting air quality data. One could say that these bike rides were ‘all in the name of science’.

This summer, a colleague of mine - Boris Bonn - and I led what started out as a small measurement campaign (BÄRLIN 2014) to assess and characterise different aspects of air quality in Berlin. It started with an interest in measuring volatile organic compounds (VOCs). VOCs are compounds that are found in the gas phase at ambient temperatures (hence ‘volatile’) and tend to have an odour: what you smell from flowers and trees or drying paint are the VOCs that are emitted from these sources. These compounds are precursor species in the formation of ozone. Ozone and particulate matter (PM) are the cause of the majority of the adverse health effects from air pollution. Our scientific interest in VOCs was in part because they aren’t measured all that often and even less so in cities. And while their emissions are regulated (e.g., from cars), their ambient concentrations aren’t (in contrast to e.g., PM), which means that there is no incentive to do any long-term monitoring of the VOCs. With these measurements we wanted to understand the relative contributions of natural and man-made sources of VOCs in the city environment to Berlin. Berlin is a very green city, so there are a lot of natural sources of VOCs in addition to the man-made ones that are typical of cities (e.g., cars). But my scientific enthusiasm means I digress. One thing (wanting to measure VOCs) led to another, and pretty soon we had a no-longer-so-small measurement campaign going with a number of partners that would allow the characterisation of the air pollution to be much more comprehensive. One aspect of this was the measurements by bike.
Every time I biked home this past summer I was measuring the particulate matter in the air around me – what I was breathing as I biked. So that warm blast I got when a bus pulled away in front of me, or the stink of a moped as it drove past, that all got measured. We used two instruments (generously loaned to us by the Umweltbundesamt for the duration of the campaign) that measured particulate number and size distribution. (Mobile measurements of individual VOC species are not possible at this time, otherwise I definitely would have included them!) Smaller particles tend to have greater adverse health effects than larger particles because of their sources and the fact that they can penetrate further into your lungs and bloodstream. So size distribution, along with information on how many particles are counted in each size category, can provide an interesting insight into exposure and implications for health effects. To be able to associate the particle data with conditions, sources, and location, we also video recorded the bike rides, while collecting GPS (location) data and temperature. General observations or anything out of the ordinary, including weather conditions, were recorded in a log book.
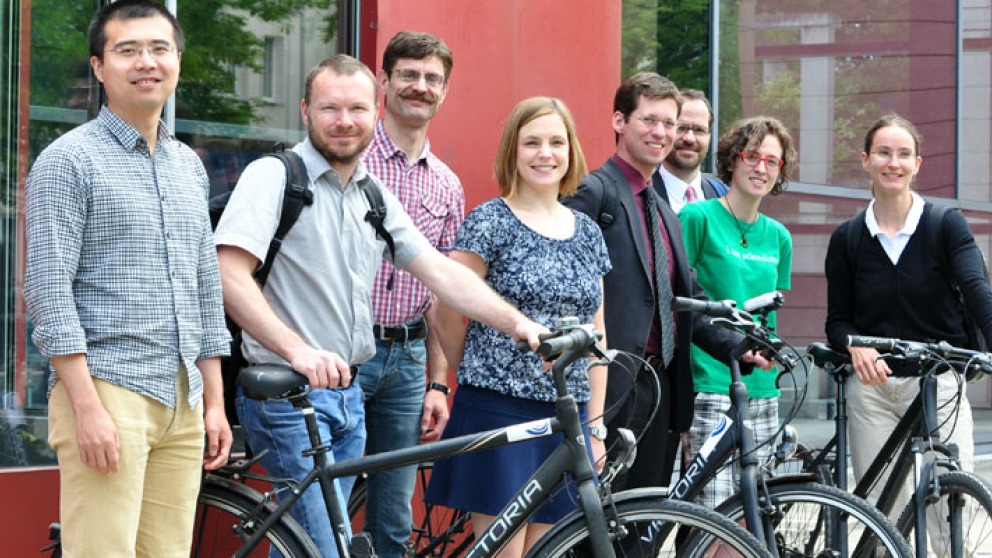
Luckily for me, I wasn’t the only one that was biking and collecting data. Many of my colleagues from the IASS also took the instruments with them on their bike commutes or other rides. What we have now is a lot of data and a lot of work to do. For now, you can see the results of these bike rides in an interactive map. The map shows the particle number counts or particle matter mass concentrations by size fraction. One important thing to remember when looking at the map is that the points very likely aren’t representative. For example, I was behind a bus at a particular intersection on one day but not the following day or week. And some days it was raining, or was really windy, both of which would tend to lower particle concentrations in the air. But since many of these routes were biked any number of times, we hope to be able to classify the data and analyse any patterns that emerge. One would assume that biking through a park would be better air quality-wise than on a busy street (and our initial assessment would confirm this), but what about biking in a shared bus-bike lane versus on a bike path that is separated from the road by a small distance or a lane of parked cars? Does that make a difference? These data will hopefully allow us to gain some insight into air pollution patterns, so that we can, for example, make recommendations on infrastructure development that would minimise exposure of bicyclists to vehicle emissions. However, if these measurements of the air quality in Berlin can’t tell us enough yet, they would still be able to provide an insight as to how, where, and when to organise future bike measurements so that we can get the greatest usable information possible from the data we collect.
Photos: IASS
